Graph information
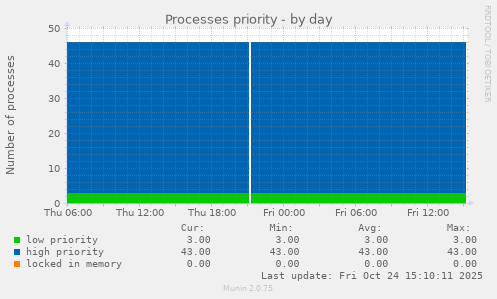
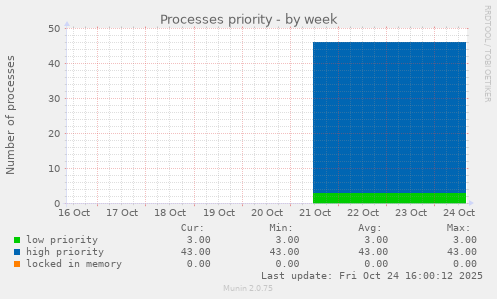
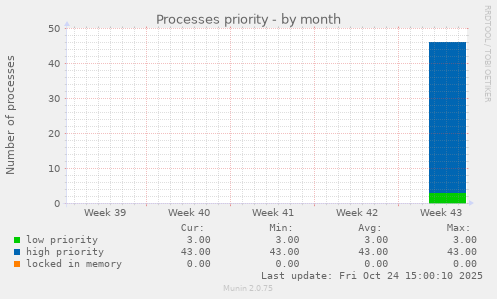
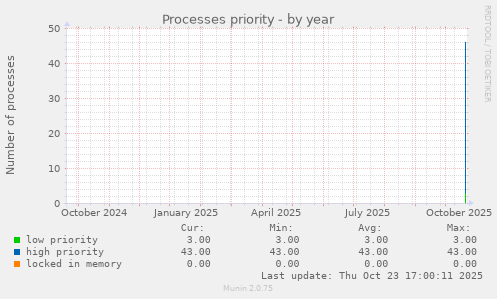
This graph shows number of processes at each priority
| Field | Internal name | Type | Warning | Critical | Info |
|---|---|---|---|---|---|
| low priority | low | gauge | The number of low-priority processes (tasks) | ||
| high priority | high | gauge | The number of high-priority processes (tasks) | ||
| locked in memory | locked | gauge | The number of processes that have pages locked into memory (for real-time and custom IO) |
Zooming is very easy, it's done in 3 clicks (regular clicks, no drag&drop):
- Click to define the start of zoom.
- Click to define the ending of zoom.
- Refresh.
You can use the interactive form too.